Approximately 15 years or so ago I watched a documentary on television about the milk industry. While it was fascinating, the one thing that caught my eye was the use of a dashboard that monitored the health of each and every cow while they were being milked. The dashboard recorded such items as quantity of milk, quality of milk, health of the individual cow e.g. body temperature, blood pressure etc. It then dawned on me that our clients should be using such tools to monitor the performance of our assets and therefore the business.
Of course in the engineering world life runs slowly and as such it has only been in recent years that I have seen a small percentage of clients using dashboards for anything at all. Recently I have seen asset management systems providing the dashboard functionality but few clients using them. It has only been in the last week where I have seen the results of one client taking the initiative and producing a near complete dashboard that their own people can use and monitor the performance of the assets.
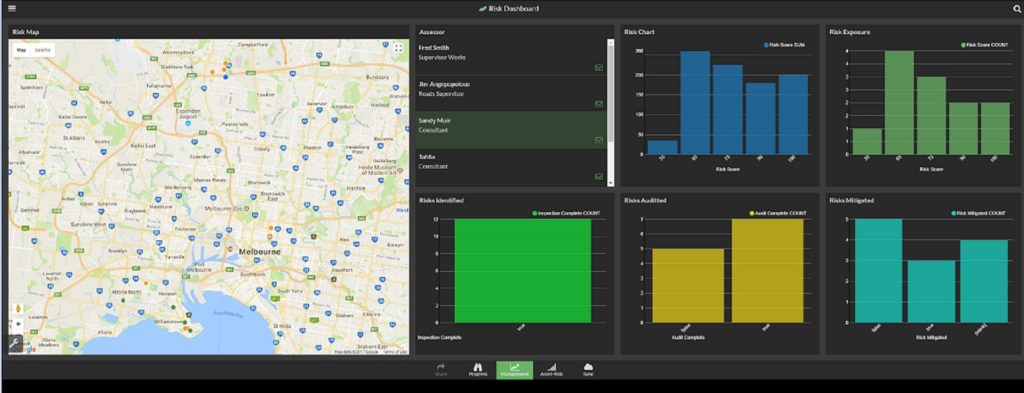
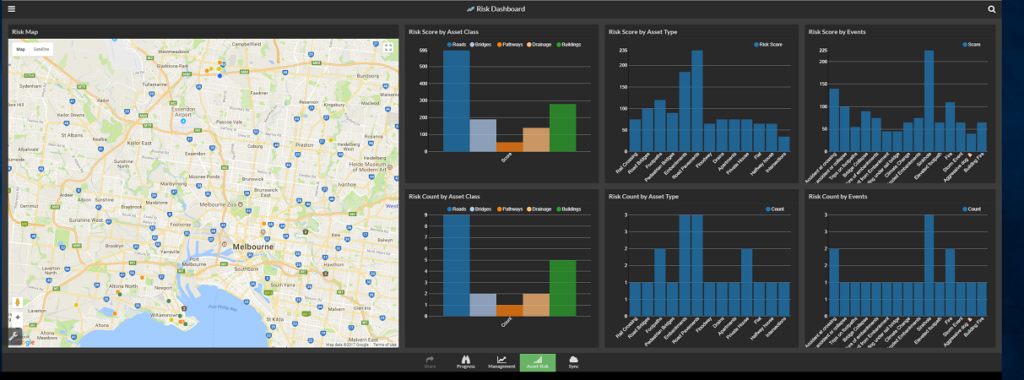
Don’t get me wrong the client’s vision has been there for many years but a significant push in the past few years has seen the dashboard become real, functional and extremely powerful. The dashboard combines data from a number of software applications in a format that provides the user the ability to interrogate the data in a way they can drill down and seek further information.
As a simple example, imagine you are the Project Manager on a condition inspection project and have sent people out to collect the condition data for bridges.
Why wait the weeks or months it will take to collect the data and provide the reports before you can analyse it? Why not monitor the progress at your desk and at the same time analyse the live data as it is entered into mobile devices? Why not build the bridge strategy as the data is collected and complete the strategy not long after the data is collected?
The above example is the same for any asset type where the data will take time to collect e.g. sewers, buildings, roads, drains, etc.
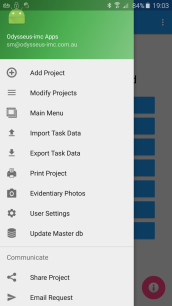
Odysseus-imc has built similar dashboards into its Apps so the the data can be interrogated live. If you wish to see an example or know about the detail, call us. We are happy to assist.